Many of us use PRTG Network Monitor for our network monitoring purpose. I personally use the free version supporting 100 sensors as it is sufficient for my network.
Now, it’s super easy to add interfaces for Bandwidth motioning via SNMP for mikrotik & other devices. We just enable SNMP on Mikrotik, add the device in PRTG & add port for SNMP Bandwidth monitoring.
But what about the static queues which we have created manually on Mikrotik? We can’t add in PRTG Mikrotik Static Queues directly like we do for all physical & logical interfaces (VLANs) present on Mikrotik. There are some small steps for doing so!
Okay, so let’s see how to add in PRTG Mikrotik Static Queues:
- Enable SNMP on Mikrotik.
- Open terminal. Issue command:
/queue simple print
- Note the number on the left hand side.

- Then issue command:
/queue simple print oid
- Note the OID Values with respect to the number captured in the previous step.

- Login to your PRTG Server. Then Add your Mikrotik device.
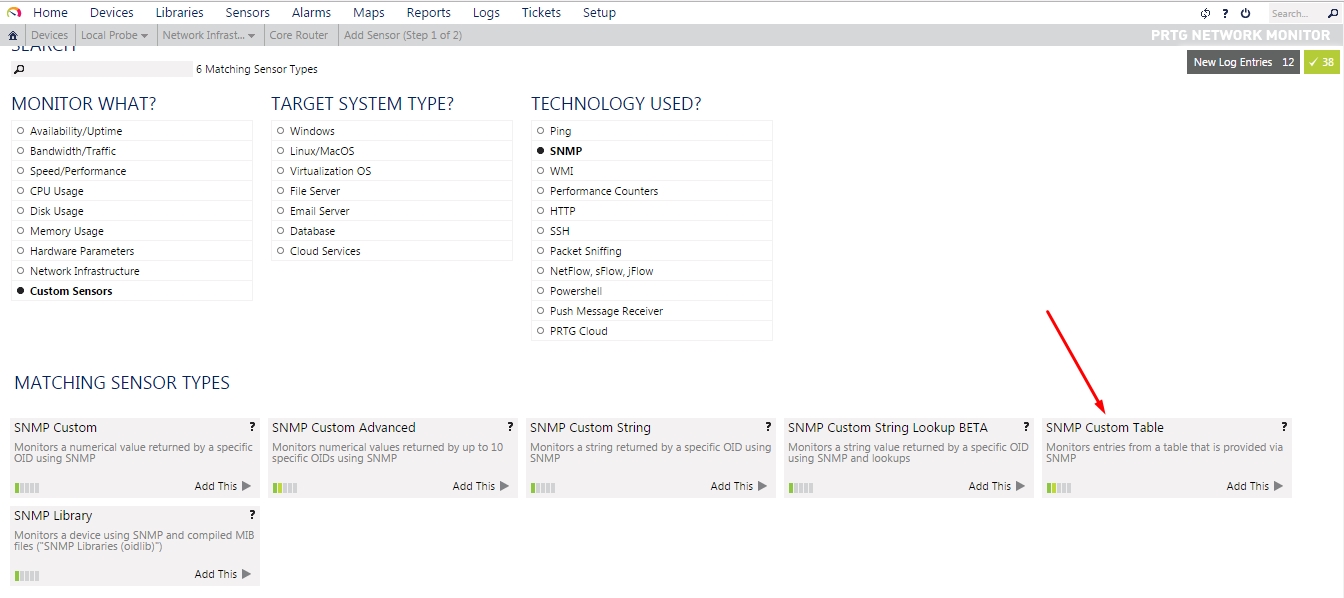
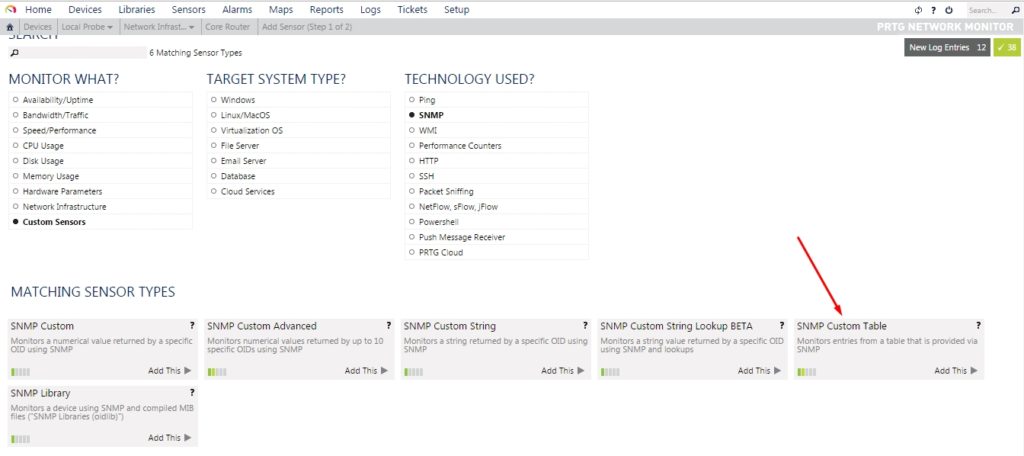
- Next click on Add Sensor. Select “SNMP” under technology used & select “Custom Sensors” under Monitor What. Then Click on SNMP Custom Table.
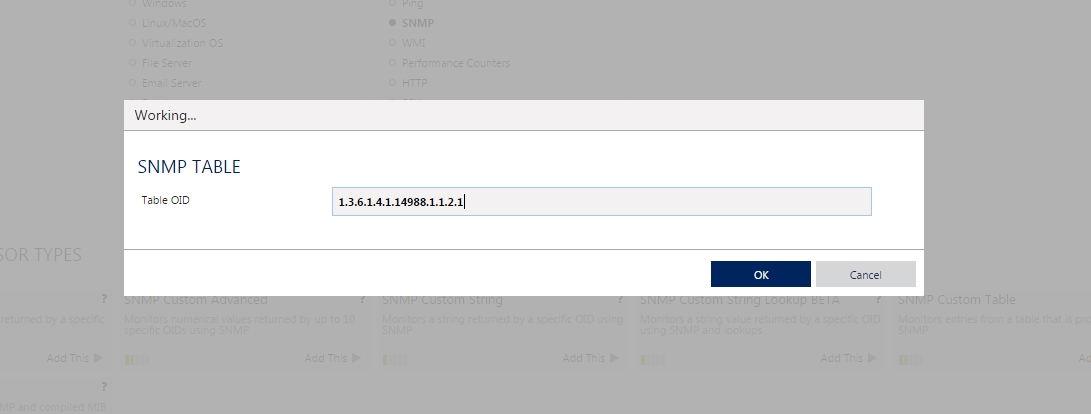
- Under Table OID give the following value -> 1.3.6.1.4.1.14988.1.1.2.1. Press Ok.

- Then from the TABLE SPECIFIC column tick the checkbox corresponding to the name of the static queue which you want to monitor.

- Then under:
Sensor Channel #1 Name write -> Traffic In.
Sensor Channel #1 Value Type -> Delta(Counter)
Sensor Channel #1 Column -> 1.3.6.1.4.1.14988.1.1.2.1.1.8 (As copied bytes-in OID value in step 5)
Sensor Channel #2 Name write -> Traffic Out.
Sensor Channel #2 Value Type -> Delta(Counter)
Sensor Channel #2 Column -> 1.3.6.1.4.1.14988.1.1.2.1.1.9 (As copied bytes-out OID value in step 5)
- Press Save
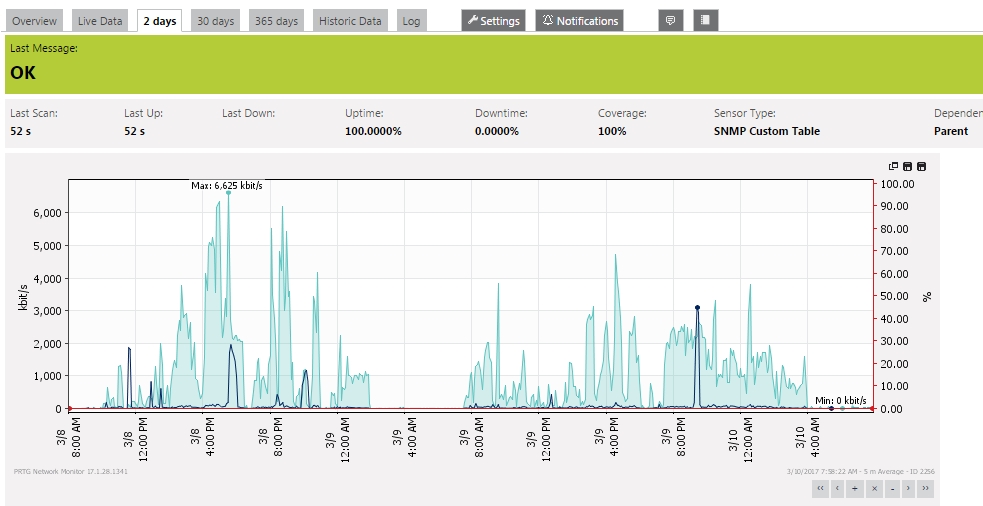
- Wait for a few minutes and your static queue graph will be generated in your PRTG Server.